
Expand Your Knowledge
Our resource center archives our case studies, published articles, blogs, webinars, and image galleries. Discover ways microscopy has made a meaningful impact.

The surge in consumer products containing nanoparticles continues to raise concern over potential exposure. Proposition 65 in California requires products containing unbound titanium dioxide nanoparticles in powder (that may become airborne and is of respirable size) to carry a warning. Therefore, screening of these cosmetics and personal care products for detection and characterization of nanoparticles is an important step in the overall assessment of risk.
This study presents nanoparticle testing results of two commercially available powdered cosmetic products for the presence of titanium dioxide nanoparticles. Product A is a pressed powder with titanium dioxide listed in the ingredient list under the “may contain” section. Product B is a loose powder with titanium dioxide listed under the “may contain” section of the ingredient list and advertised on the container as the sunscreen present. Both powders were screened for TiO2 content by automated SEM-EDS analysis followed by a detailed TEM analysis to determine the smallest particle size and morphology.
Product A
Automated SEM-EDS analysis of Product A detected 389 Ti + O-rich aggregates or individual nanoparticles. Of these 389 particles, 8.5% (33 particles) were in the 50-100 nm size range and all were below 2.0μm in diameter. A distribution of particles by estimated mass is also presented in Table 1. TEM analysis of pressed powder Product A revealed that the majority of titanium dioxide nanoparticles present were in the form of aggregates (Figure 1). A few individual primary particles were also observed (Figure 2). Figure 3 presents a particle size distribution of TiO2 aggregates and primary particles observed in Product A. The average particle size was 490 ± 232nm with 311 particles measured. Analysis of the airborne exposure sample by TEM was performed on a detection only basis. Of 10 grid openings analyzed (0.1mm2), two TiO2 aggregates were observed. A representative aggregate is shown in Figure 4. The sizes of the two aggregates observed were 504nm and 266nm, respectively.
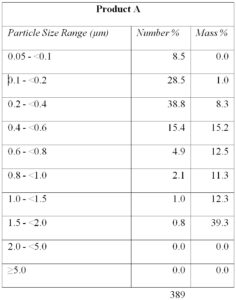
Table 1. Percentages of Particles in Various Diameter Ranges by Number and Mass of Particles – Product A.
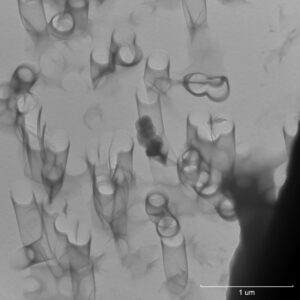
Figure 1. TEM image of TiO2 aggregate in Product A.
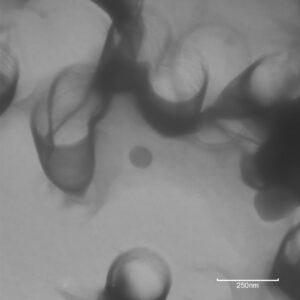
Figure 2. TEM image of TiO2 primary particle in Product A.
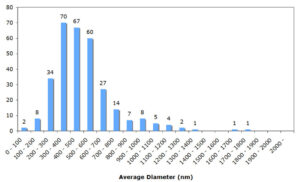
Figure 3. Particle size distribution of aggregates and primary particles in Product A.
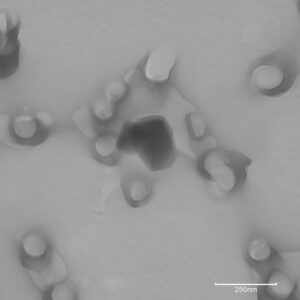
Figure 4. TEM image of TiO2 aggregate observed on filter from airborne exposure study of Product A.
Product B
Automated SEM-EDS analysis of Product B detected 485 Ti + O-rich aggregates or individual particles. Of these 485 particles, 8.5% (41 particles) were in the 50-100nm size range and all were below 5.0μm in diameter. A distribution of particles by estimated mass is also presented in Table 2.
TEM analysis of loose powder Product B revealed that the majority of TiO2 present was in the form of aggregates (Figure 5). Several individual primary particles were also observed (Figure 6). Figure 7 presents a particle size distribution of TiO2 aggregates and primary particles observed in Product B. The average particle size was 269 ± 148nm with 250 particles measured.
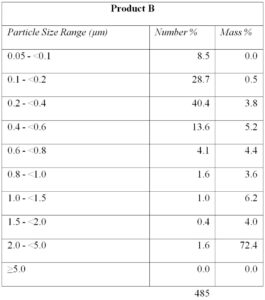
Table 2. Percentages of Particles in Various Diameter Ranges by Number and Mass of Particles – Product B.
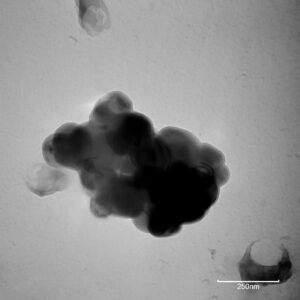
Figure 5. TEM image of TiO2 aggregate in Product B.
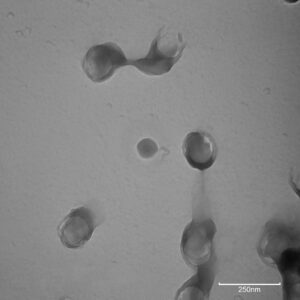
Figure 6. TEM image of TiO2 primary particle in Product B.
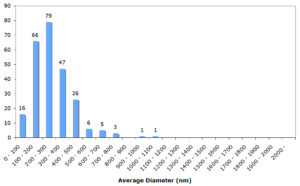
Figure 7. Particle size distribution of aggregates and primary particles in Product B.
Automated SEM-EDS analysis of pressed powder Product A and loose powder Product B detected TiO2 particles in the 50-100nm size range. However, the technique does not allow for determination of whether these particles were aggregates or primary particles. Additionally, the instrument/method has a detection limit of 50nm thus preventing determination of a minimum particle size if it is below this limit.
TEM analyses verified the presence of TiO2 particles in both Product A and Product B that were below 100nm in diameter. In both cases, primary particles were observed that fell in the ≤ 100nm size range. In Product B, the minimum particle size observed was 40nm, below the detection limit of the automated SEM-EDS method.
Our resource center archives our case studies, published articles, blogs, webinars, and image galleries. Discover ways microscopy has made a meaningful impact.

