Expand Your Knowledge
Our resource center archives our case studies, published articles, blogs, webinars, and image galleries. Discover ways microscopy has made a meaningful impact.
Confocal Raman Microscopy/Spectroscopy (CRM) brings together confocal imaging and Raman spectroscopy to provide capabilities not available to either Fourier transform infrared (FTIR) spectroscopy or the scanning electron microscope (SEM). CRM’s high resolution also fills a dimensional measurement gap between those two techniques. The confocal imaging system can achieve spatial resolution down to 440 nanometers, which permits collection of Raman spectra from very tightly defined areas within a sample. This dramatically improves the ability to identify molecular-level components of both organic and inorganic samples.
Because laser-illumination energy can penetrate the surface of samples, CRM can also reveal Raman spectroscopic data from subsurface layers. The confocal imaging system allows precise control of the depth where the spectroscopic data is acquired. This depth control (Z-axis imaging) allows layered samples to be analyzed without cutting cross-sections.
CRM’s digital Raman spectroscopy data can be stored and processed to reduce the effect of background-noise pollution in the electronic systems, which allows more accurate interpretation of noisy spectral data from trace components.
Our experts provide a wide spectrum of Raman analysis and Raman mapping applications. Raman analysis is an ideal technique for the qualitative and semi-quantitative analyses of organic and/or inorganic mixed materials. Samples analyzed by Raman spectroscopy include proteins, polymers, pharmaceuticals, minerals and other inorganics.
In summary, Raman mapping and imaging analysis provides a spectral image with consistent resolution of 200 nanometers. Raman analysis allows laser-illuminated Raman spectroscopy to focus on very tightly defined sample areas, dramatically improving the ability to identify molecular-level components of both organic and inorganic samples.

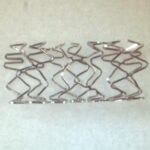
Photo: Tablet prior to Raman mapping

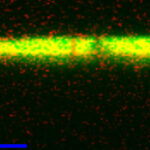
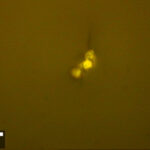
Photo: Raman mapping analysis of component distributions in a tablet. Each color represents one ingredient. The color map shows the composite of five ingredients.
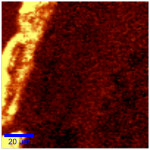
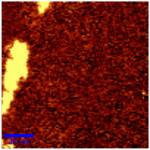
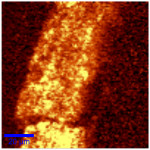
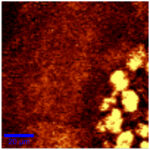
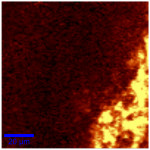
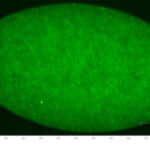
Photos: Each map shows the distribution of one component within the tablet.
Click thumbnail to enlarge image.


At MVA Scientific Consultants, we provide our customers with a full range of Raman analyses to test and analyze small contamination areas, identify materials in small target areas, and measure stress in a variety of materials.
For more information, email info@mvainc.com or call 770-662-8509.